Agrifood Value Chains are Complex Transaction-Linked Networks What Does this Mean for Sampling Methodology?
Agrifood value chains are an integral part of food systems, moving food from farms where it is produced to retailers where it is sold to consumers. Agrifood value chains can be quite simple—consumers can buy directly from farms at farmers’ markets, for example—or they can be quite complex, involving processing steps on multiple continents before products reach retailers. Yet research often sets aside these distinctions and depicts agrifood value chains as highly stylized and simple—typically as a simplified series of steps involving traders, aggregators, processors, and/or wholesalers between farms and retailers. The most common method for studying multiple intermediary actors within agrifood value chains—“stacked surveys” that randomly sample respondents within each of these steps—follows this simplified approach.
We know that these stylized illustrations oversimplify agrifood value chains—for example, some farmers of a specific crop might sell to a neighbor who then sells in a local market to a larger trader, while other farmers take the crop directly to the trader. Unfortunately, there is little evidence about the complexity of these buying and selling patterns and the implications of this complexity on sampling methodology. To help fill that gap, we use a network-based survey that aims to better capture the range of these relationships within agrifood value chains. The graphic below illustrates descriptive statistics from the survey, depicting buyers and sellers in various value chain interactions by type of actor.
Buying and Selling Patterns for Agrifood Value Chains
This figure illustrates that the structure of agri-food value chains can be nonlinear. Each bar in the wheel below represents the share of the total volume a given value chain actor type buys or sells from given sources. For example, the average rice trader in our data buys 73% of the rice they trade from individual farmers. Click on the plus sign by the type of value chain actor to spin the wheel.
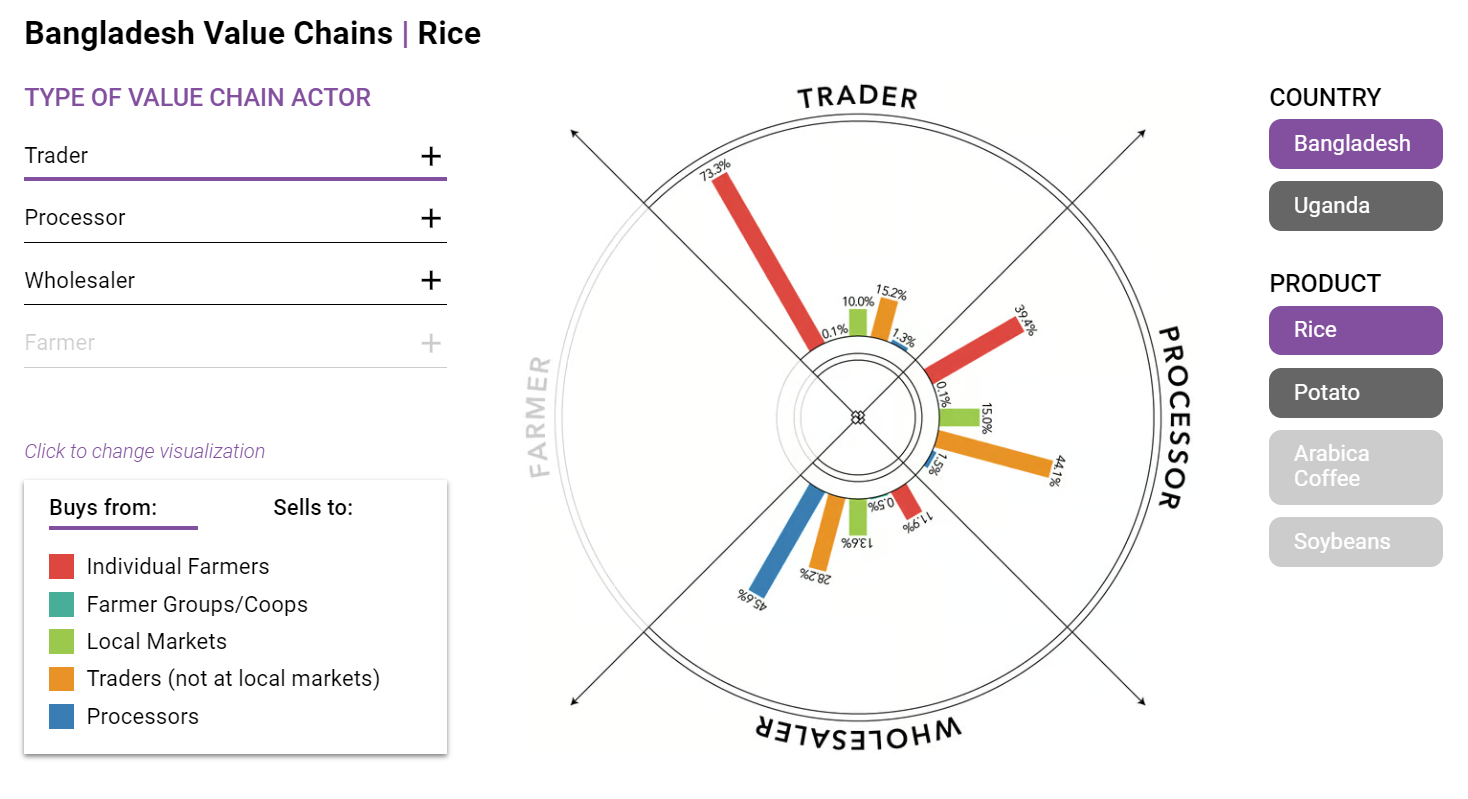
We focus on four agrifood value chains in two countries (rice and potatoes in Bangladesh, and arabica coffee and soy in Uganda), chosen for differences in structure and level of organization. The wheel in the graphic shows two or three types of value chain actors for purchases as reported by respondents: Traders, processors, and wholesalers (soy in Uganda and potatoes in Bangladesh were generally not processed within our study areas). For sales, the wheel also includes farmers. In Uganda we focused our data collection in Mbale district on the east side of the country near Mount Elgon and Kasese district on the west side of the country near the Rwenzori mountains—regions representing major production and processing areas for arabica coffee in the country. We also worked in Lira district in the northern region of Uganda, one of the country’s most prominent production and trading areas for soy. In each of these three districts, we conducted data collection in April and May of 2023. In Bangladesh, we implemented our survey in the northern Bogra and Rangpur districts, representing a large share of the local and hybrid varieties of the country’s potato production; rice is produced throughout Bangladesh. In these two districts, we conducted data collection between June and August of 2023. The survey started with a small group of farmers, who gave enumerators information about their crop sales. Enumeration teams then tracked down the individuals who purchased those crops, and they in turn were asked about the sellers they purchased from and the buyers to whom they sold. This process was repeated until the next connection either was already in our data or could not be found, generating data that provides a comprehensive view of intermediary agrifood value chain actors within their transaction-linked networks. For all four value chains in the two countries, we find that buying and selling patterns are complex. For example, for rice in Bangladesh, we find that 73% of purchases by traders come from farmers, meaning that the other 27% of their purchases come from other places—a combination of local markets, other traders, and processors. Meanwhile, wholesalers are most likely to sell rice to local markets or other wholesalers, with 21% of sales to traders and 15% to processors. Similarly, farmers do not sell only to traders. Again, focusing on rice in Bangladesh, we find that only 45% of farmers sell to traders directly; another 39% sell to local markets (i.e., physical locations with a collection of market retailers), with the remainder selling to processors and wholesalers. We studied value chains with different characteristics to understand whether their differing levels of organization would influence the way transactions take place. Take, for example, arabica coffee in Uganda. Almost all of this product ends up with registered exporters, while different grades must be processed in specific ways before those sales are made. If the value chain had the structure that the simple and stylized models suggest, we would expect to observe farmers selling to traders, who then sell to processors and then to wholesalers, who then sell to exporters. Instead, although we find that many farmers sell coffee to traders, roughly a quarter of coffee sales go directly to either local markets, processors, or wholesalers. These findings suggest ways to improve data collection on intermediary agrifood value chain actors. If we view agrifood value chains as a series of simplified steps, then it seems reasonable to organize a data collection approach that follows this simple structure, such as the predominant “stacked survey” approach that might randomly sample traders, then processors, and finally wholesalers or market retailers. Yet the complex nature of buying and selling relationships of intermediary agrifood value chain actors presents several challenges for this approach. For instance, randomly sampling within segments generates a sample with respondents selected independently of their buying and selling relationships between segments. Moreover, the informal and mobile nature of many intermediary agrifood value chain actors complicates the construction of a reliable sampling frame, which is necessary for the valid random sampling of respondents. Thus, the use of simple sampling methodologies to collect data within potentially complex transaction-linked networks of agrifood value chains runs the risk of collecting non-representative data and making biased inferences based on that data. In sum, the network-based surveys we fielded make two important points. First, the transactions within agrifood value chains are more complex than stylized value chain diagrams would have us believe. Even within a single crop in a specific region of one country, there are many different paths that an agricultural product can take before it reaches either a processor who transforms it into a type of food, or a retailer. Second, had we conducted the common “stacked surveys” approach to learn about these agrifood value chains, we would have likely observed very different patterns, potentially more consistent with the expected standardized structure, yet not capturing complex value chain dynamics.
Kate Ambler and Alan de Brauw are Senior Research Fellows with IFPRI's Markets, Trade, and Institutions (MTI) Unit; Jeff Bloem is an MTI Research Fellow; Julia Wagner is an MTI Research Analyst. This post is based on research that is not yet peer-reviewed.
This work is supported by the Bill & Melinda Gates Foundation.